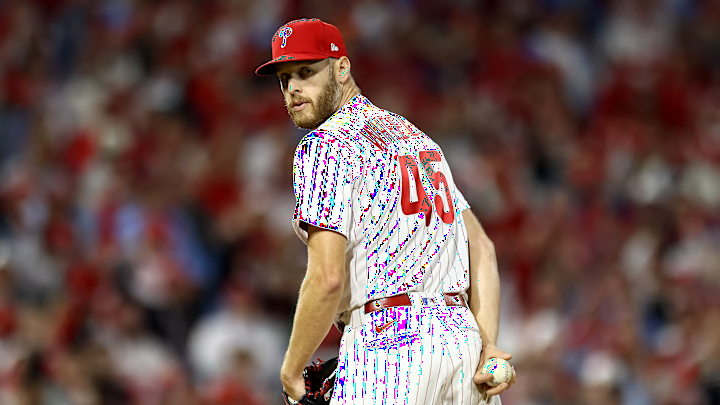
The Philadelphia Phillies' NL East rival and six-time defending division champion Atlanta Braves recently made news by trading for Chris Sale from the Boston Red Sox. The move was met with surprise and, specifically for Phillies fans, concern that this addition has widened the gap between the two teams.
The Phillies and Braves are seen as the class of the NL East right now and maybe even of the entire National League, along with the Dodgers. Starting pitching will always be a big influence on how a team performs through the regular season and playoffs.
The Braves, in recent memory, have been known to make smart, sensible, and promising moves that have contributed to their prolonged success, so why would we expect this trade to be any different?
Sure, on paper, adding the hard-throwing lefty to this already dangerous starting rotation seems like a great move. But dig in deeper and it might not be as open-and-close as one might think.
The Phillies, in their own right, have a very strong starting rotation with their top two aces, under-the-radar performers, and a mix of veterans and young guys who can contribute. According to FanGraphs, the Phillies and Braves actually project out as having two of the best starting rotations in 2024.
After the acquisition of Sale, the Braves are projected to have the best starting rotation in Major League Baseball, with the Phillies a close second. When factoring in the depth spots of the starting rotations outside the top five, the combined fWAR between all of the projected Braves starters is 16.1 while the total fWAR for all of the Phillies' projected starters is 15.3.
It’s extremely tight when looking at the totality but even tighter when looking at just the top five. The Phillies' top five starters actually have a higher combined fWAR at 14.9 than the Braves' top five, who have a projected 14.6 fWAR.
So how do these two rotations stack up pitcher by pitcher?
